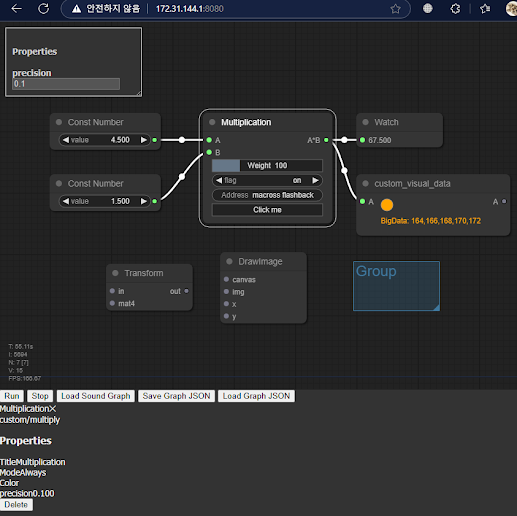
<html>
<head>
<title>custom lite graph app</title>
<meta http-equiv="X-UA-Compatible" content="chrome=1">
<link rel="stylesheet" type="text/css" href="style.css">
<link rel="stylesheet" type="text/css" href="litegraph.css">
<link rel="stylesheet" type="text/css" href="litegraph-editor.css">
<script type="text/javascript" src="litegraph.js"></script>
<script type="text/javascript" src="litegraph-editor.js"></script>
<style>
#propertyPane {
position: absolute;
top: 10px;
left: 10px;
width: 200px;
padding: 10px;
border: 1px solid #ccc;
background-color: #333; /* Dark gray background */
color: #ccc; /* Light gray text */
resize: both;
overflow: auto;
}
#propertyPane input {
background-color: #555; /* Darker gray for input background */
color: #ccc; /* Light gray text for input */
border: 1px solid #777; /* Border color for input */
}
#propertyPane label {
color: #ccc; /* Light gray text for labels */
}
</style>
</head>
<body style='width:100%; height:100%'>
<canvas id='mycanvas' width="1000" height="600"></canvas>
</br>
<button id="runButton">Run</button>
<button id="stopButton">Stop</button>
<button id="loadSoundButton">Load Sound Graph</button>
<button id="saveButton">Save Graph JSON</button>
<button id="loadGraphButton">Load Graph JSON</button>
<div id="propertyPane">
<h4>Properties</h4>
<div id="properties"></div>
</div>
<script>
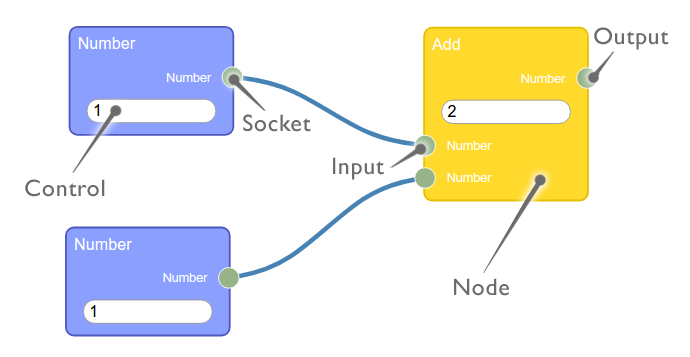
class custom_multi_node {
constructor(){
this.title = "Multiplication";
this.addInput("A","number");
this.addInput("B","number");
this.addOutput("A*B","number");
this.properties = { precision: 0.1 };
this.weightHandle = this.addWidget("slider","Weight", 100, {min: 0, max: 400, step: 10, precision: 0})
this.addWidget("combo","flag", "on", {values: ["on","off"]})
this.addWidget("text", "Address", "macross flashback")
this.addWidget("button","Click me", "", function() { alert("button clicked") })
this.serialize_widgets = true
}
onExecute(){
let a = this.getInputData(0) || 0;
let b = this.getInputData(1) || 0;
let result = a * b * this.properties.precision * this.weightHandle.value;
this.setOutputData(0, result);
}
onPropertyChanged(name, value) {
console.log(`Property ${name} changed to ${value}`);
// alert(`Property ${name} changed to ${value}`);
}
}
class custom_visual_data {
count = 0;
bigdata_result = null;
constructor(){
this.title = "custom_visual_data";
this.addInput("A","number");
this.addOutput("A","number");
this.properties = { scale: 1.0 };
this.size = [250, 70];
}
onExecute(){
let a = this.getInputData(0) || 0;
a = a * this.properties.scale;
this.setOutputData(0, a);
this.count++;
this.count = this.count % 256;
this.setDirtyCanvas(true);
// this.trigger("onDrawBackground");
this.bigdata_result = null;
calculate_bigdata(this);
}
finish_bigdata(dataset) {
this.bigdata_result = dataset;
console.log("Finished async data calculation");
}
onAdded(){
}
onRemoved(){
}
onDropFile(file){
alert("File dropped: " + file.name);
}
onDrawBackground(ctx){
ctx.save(); // Save the current state
ctx.beginPath();
ctx.rect(0, 0, this.size[0], this.size[1]); // Define the clipping region
ctx.clip();
let blue = Math.max(0, 255 - this.count % 256);
let orange = Math.min(255, this.count % 256);
ctx.fillStyle = `rgb(${orange}, ${Math.floor(orange / 2)}, ${blue})`; // Smooth transition from blue to orange
ctx.strokeStyle = "#808080"; // Gray color
ctx.beginPath();
ctx.arc(50,20,10,0,Math.PI*2);
if(this.bigdata_result){
ctx.font = "12px Arial";
ctx.fillStyle = "orange";
ctx.fillText("BigData: " + this.bigdata_result, 40, 50);
}
ctx.fill();
ctx.stroke();
ctx.restore(); // Restore the previous state */
}
}
async function processLargeData(data) {
return new Promise((resolve) => {
console.log("starting async data processing");
setTimeout(() => {
const processedData = data.map((item) => item * 2); // data double scale
console.log("finished async data processing");
resolve(processedData);
}, 3000); // processing time estimation
});
}
async function calculate_bigdata(node) {
const data = [1, 2, 3, 4, 5].map(item => item + node.count); // input data for example
const processedData = await processLargeData(data); // async data processing
console.log("Processed data:", processedData);
node.finish_bigdata(processedData);
}
LiteGraph.registerNodeType("custom/multiply", custom_multi_node);
LiteGraph.registerNodeType("custom/VisualData", custom_visual_data);
var graph = new LGraph();
var canvas = new LGraphCanvas("#mycanvas", graph);
graph.allow_scripts = true;
canvas.allow_searchbox = true;
/*
update_canvas_HiPPI();
window.addEventListener("resize", function() {
canvas.resize();
update_canvas_HiPPI();
});
function update_canvas_HiPPI() {
const ratio = window.devicePixelRatio;
if(ratio == 1)
return;
const rect = editor.canvas.parentNode.getBoundingClientRect();
const { width, height } = rect;
canvas.width = width * ratio;
canvas.height = height * ratio;
canvas.style.width = width + "px";
canvas.style.height = height + "px";
canvas.getContext("2d").scale(ratio, ratio);
return canvas;
}
*/
var nodeConstA = LiteGraph.createNode("basic/const");
nodeConstA.pos = [100,200];
nodeConstA.setValue(4.5);
graph.add(nodeConstA);
var nodeConstB = LiteGraph.createNode("basic/const");
nodeConstB.pos = [100,300];
nodeConstB.setValue(1.5);
graph.add(nodeConstB);
var nodeMult = LiteGraph.createNode("custom/multiply");
nodeMult.pos = [350,200];
graph.add(nodeMult);
var nodeWatch = LiteGraph.createNode("basic/watch");
nodeWatch.pos = [600,200];
graph.add(nodeWatch);
var nodeAsync = LiteGraph.createNode("custom/VisualData");
nodeAsync.pos = [600,300];
graph.add(nodeAsync);
// All nodes must be in the graph before connections can be made.
nodeConstA.connect(0, nodeMult, 0);
nodeConstB.connect(0, nodeMult, 1);
nodeMult.connect(0, nodeWatch, 0);
nodeMult.connect(0, nodeAsync, 0);
// Add event listener to the run button
document.getElementById("runButton").addEventListener("click", function() {
graph.start();
});
// Add event listener to the stop button
document.getElementById("stopButton").addEventListener("click", function() {
graph.stop();
});
// Add event listener to show properties when a node is clicked
canvas.onNodeSelected = function(node) {
var propertiesDiv = document.getElementById("properties");
propertiesDiv.innerHTML = "";
for (var property in node.properties) {
if (node.properties.hasOwnProperty(property)) {
var input = document.createElement("input");
input.type = "text";
input.value = node.properties[property];
input.onchange = (function(property, node) {
return function(event) {
node.setProperty(property, event.target.value);
};
})(property, node);
var label = document.createElement("label");
label.innerText = property;
propertiesDiv.appendChild(label);
propertiesDiv.appendChild(input);
propertiesDiv.appendChild(document.createElement("br"));
}
}
};
document.getElementById("loadSoundButton").addEventListener("click", function() {
fetch('audio_delay.json')
.then(response => response.json())
.then(data => {
graph.configure(data);
alert('Sound graph loaded');
})
.catch(error => console.error('Error loading JSON:', error));
});
document.getElementById("loadGraphButton").addEventListener("click", function() {
fetch('saved_graph.json')
.then(response => response.json())
.then(data => {
graph.configure(data);
alert('saved_graph loaded');
})
.catch(error => {
console.error('Error loading JSON:', error);
alert('Error loading JSON: ' + error.message);
});
});
document.getElementById("saveButton").addEventListener("click", function() {
var data = JSON.stringify(graph.serialize());
var blob = new Blob([data], { type: 'application/json' });
var url = URL.createObjectURL(blob);
var a = document.createElement('a');
a.href = url;
a.download = 'saved_graph.json';
a.click();
URL.revokeObjectURL(url);
});
</script>
</body>
</html>
전체 화면에 그래프 캔버스 크기를 맞출려면, 위 소스에서 update_canvas_HiPPI() 부분 함수 리마크 처리를 해제한다.

