PyGeometric은 GCN(Graph Convolutional Networks)와 같은 모델과 데이터셋이 내장되어 있다. 이와 관련해 좀 더 상세한 내용은 다음 링크를 참고한다.
다음 링크를 참고해, 패키지를 설치한다.
다음과 같은 논문 레퍼런스+키워드 그래프 데이터를 학습한다. 이런 그래프는 분자식, 소셜관계도 등 다양한 곳에서 찾아볼 수 있으며, 학습 방법도 유사하다.
각 논문 특징을 설명하는 1433개 고유 단어가 특징이며, 논문의 해당 단어 유무는 0/1로 표현된다. Edge는 5429개 인용 연결이 있다. 우선, cora데이터를 로딩하고, 가시화해본다.
from torch_geometric.utils import to_networkx
import matplotlib.pyplot as plt
import random
import networkx as nx
dataset = Planetoid(root='/tmp/Cora', name='Cora')
graph = dataset[0]
def convert_to_networkx(graph, n_sample=None):
g = to_networkx(graph, node_attrs=["x"])
y = graph.y.numpy()
if n_sample is not None:
sampled_nodes = random.sample(g.nodes, n_sample)
g = g.subgraph(sampled_nodes)
y = y[sampled_nodes]
return g, y
def plot_graph(g, y):
plt.figure(figsize=(9, 7))
nx.draw_spring(g, node_size=30, arrows=False, node_color=y)
plt.show()
g, y = convert_to_networkx(graph, n_sample=1000)
plot_graph(g, y)
다음과 같이, 데이터셋은 2708개 노드 x 1433 워드 텐서 및 에지를 가진다.
NetworkX라이브러리를 통한 시각화 결과는 다음 같다.
학습 데이터셋의 논문 참조 그래프 표시
이제,
RandomNodeSplit 함수를 이용해 그래프 학습 데이터를 분할하고, 노드 데이터만 (모서리는 무시) 고려해, 노드 라벨을 분류하기로 한다. 이를 위해 MLP 모델을 정의한다. 코드에서 ()는 텐서 shape이다.
import torch
import torch.nn as nn
import torch_geometric.transforms as T
device = torch.device('cuda' if torch.cuda.is_available() else 'cpu')
split = T.RandomNodeSplit(num_val=0.1, num_test=0.2)
graph = split(graph)
class MLP(nn.Module):
def __init__(self):
super().__init__()
self.layers = nn.Sequential(
nn.Linear(dataset.num_node_features, 64),
nn.ReLU(),
nn.Linear(64, 32),
nn.ReLU(),
nn.Linear(32, dataset.num_classes)
) # (1433, 64), (64, 32), (32, 7)
def forward(self, data):
x = data.x # only using node features (x). # input = (2708, 1433)
output = self.layers(x) # label = (2708, 7)
return output
def train_node_classifier(model, graph, optimizer, criterion, n_epochs=200):
for epoch in range(1, n_epochs + 1):
model.train()
optimizer.zero_grad()
out = model(graph.to(device))
loss = criterion(out[graph.train_mask], graph.y[graph.train_mask])
loss.backward()
optimizer.step()
pred = out.argmax(dim=1)
acc = eval_node_classifier(model, graph, graph.val_mask)
if epoch % 10 == 0:
print(f'Epoch: {epoch:03d}, Train Loss: {loss:.3f}, Val Acc: {acc:.3f}')
return model
def eval_node_classifier(model, graph, mask):
model.eval()
pred = model(graph).argmax(dim=1)
correct = (pred[mask] == graph.y[mask]).sum()
acc = int(correct) / int(mask.sum())
return acc
mlp = MLP().to(device)
optimizer_mlp = torch.optim.Adam(mlp.parameters(), lr=0.01, weight_decay=5e-4)
criterion = nn.CrossEntropyLoss()
mlp = train_node_classifier(mlp, graph, optimizer_mlp, criterion, n_epochs=150)
test_acc = eval_node_classifier(mlp, graph, graph.test_mask)
print(f'Test Acc: {test_acc:.3f}')
MLP만 사용한 그래프 데이터 학습 모델 결과 정확도는 0.744이다.
이제 PyGeometric을 사용해 학습한다. 두 개의 GCNConv만 사용한다. 각 노드의 특징은 1433개이므로, GCNConv의 shape=(1433, 16)이고, 두번째 GCNConv는 (16, 7)을 가진다.
from torch_geometric.nn import GCNConv
import torch.nn.functional as F
class GCN(torch.nn.Module):
def __init__(self):
super().__init__()
self.conv1 = GCNConv(dataset.num_node_features, 16)
self.conv2 = GCNConv(16, dataset.num_classes)
def forward(self, data):
x, edge_index = data.x, data.edge_index # (2708, 1433), (2, 10556)
x = self.conv1(x, edge_index) # node, edge index. (2708, 16)
x = F.relu(x)
output = self.conv2(x, edge_index) # (2708, 7)
return output
gcn = GCN().to(device)
optimizer_gcn = torch.optim.Adam(gcn.parameters(), lr=0.01, weight_decay=5e-4)
criterion = nn.CrossEntropyLoss()
gcn = train_node_classifier(gcn, graph, optimizer_gcn, criterion)
test_acc = eval_node_classifier(gcn, graph, graph.test_mask)
print(f'Test Acc: {test_acc:.3f}')
GCN 결과는 0.869로 정확도가 개선되었다.
이제, 모서리(링크) 예측을 해본다. 이를 위해, 두개 컨볼루션 이용해 노드 임베딩을 만든다. 원 본 그래프에 이진 분류를 위해 연결되지 않은 두개 노드 간에 음수 링크를 추가한다.
이를 이용해, 이진 분류를 학습한다.
from sklearn.metrics import roc_auc_score
from torch_geometric.utils import negative_sampling
class Net(torch.nn.Module):
def __init__(self, in_channels, hidden_channels, out_channels):
super().__init__()
self.conv1 = GCNConv(in_channels, hidden_channels)
self.conv2 = GCNConv(hidden_channels, out_channels)
def encode(self, x, edge_index):
x = self.conv1(x, edge_index).relu()
return self.conv2(x, edge_index)
def decode(self, z, edge_label_index):
return (z[edge_label_index[0]] * z[edge_label_index[1]]).sum(
dim=-1
) # product of a pair of nodes on each edge
def decode_all(self, z):
prob_adj = z @ z.t()
return (prob_adj > 0).nonzero(as_tuple=False).t()
def train_link_predictor(
model, train_data, val_data, optimizer, criterion, n_epochs=100
):
for epoch in range(1, n_epochs + 1):
model.train()
optimizer.zero_grad()
z = model.encode(train_data.x, train_data.edge_index)
# sampling training negatives for every training epoch
neg_edge_index = negative_sampling(
edge_index=train_data.edge_index, num_nodes=train_data.num_nodes,
num_neg_samples=train_data.edge_label_index.size(1), method='sparse')
edge_label_index = torch.cat(
[train_data.edge_label_index, neg_edge_index],
dim=-1,
)
edge_label = torch.cat([
train_data.edge_label,
train_data.edge_label.new_zeros(neg_edge_index.size(1))
], dim=0)
out = model.decode(z, edge_label_index).view(-1)
loss = criterion(out, edge_label) # 모서리 특징 차이를 손실로 계산
loss.backward()
optimizer.step()
val_auc = eval_link_predictor(model, val_data)
if epoch % 10 == 0:
print(f"Epoch: {epoch:03d}, Train Loss: {loss:.3f}, Val AUC: {val_auc:.3f}")
return model
@torch.no_grad()
def eval_link_predictor(model, data):
model.eval()
z = model.encode(data.x, data.edge_index)
out = model.decode(z, data.edge_label_index).view(-1).sigmoid()
return roc_auc_score(data.edge_label.cpu().numpy(), out.cpu().numpy())
import torch_geometric.transforms as T
split = T.RandomLinkSplit(
num_val=0.05,
num_test=0.1,
is_undirected=True,
add_negative_train_samples=False,
neg_sampling_ratio=1.0,
)
train_data, val_data, test_data = split(graph)
model = Net(dataset.num_features, 128, 64).to(device)
optimizer = torch.optim.Adam(params=model.parameters(), lr=0.01)
criterion = torch.nn.BCEWithLogitsLoss()
model = train_link_predictor(model, train_data, val_data, optimizer, criterion)
test_auc = eval_link_predictor(model, test_data)
print(f"Test: {test_auc:.3f}")
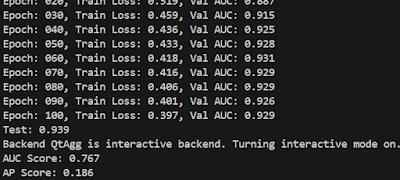
AUC 결과는 94.3%이다.
이제, 이상탐지를 처리한다. 이를 위해, 이상탐지 라이브러리 PyGOD 를 임포트한다. 여기에 미리 이상치가 입력된 Cora 데이터셋을 사용한다.
from pygod.utils import load_data
from collections import Counter
graph = load_data('inj_cora')
"""
0: inlier
1: contextual outlier only
2: structural outlier only
3: both contextual outlier and structural outlier
"""
Counter(graph.y.tolist())
from pygod.detector import DOMINANT
from sklearn.metrics import roc_auc_score, average_precision_score
def train_anomaly_detector(model, graph):
return model.fit(graph)
def eval_anomaly_detector(model, graph):
outlier_scores = model.decision_function(graph)
auc = roc_auc_score(graph.y.numpy(), outlier_scores)
ap = average_precision_score(graph.y.numpy(), outlier_scores)
print(f'AUC Score: {auc:.3f}')
print(f'AP Score: {ap:.3f}')
graph.y = graph.y.bool()
model = DOMINANT()
model = train_anomaly_detector(model, graph)
eval_anomaly_detector(model, graph)
제대로 수행되면 AUC, AP 결과는 다음과 같다.
마무리
이 글을 통해, PyGeometric 기반 그래프 데이터 학습 방법을 알아보았다. 분자식, 소셜 관계 등 그래프 형식으로 표현되는 데이터셋은 이런 방식으로 특징을 학습하고, 이상탐지 등 다양한 작업을 할 수 있다.


